Forex Trading: The Complete Guide for Beginners (2026)

A structured path from 'what is a pip?' to placing your first risk-managed trade on MT5. Written by someone who has actually funded a prop account: honest about the odds, specific about the math, independent of any broker.
James Mitchell
Senior Trading Analyst · MSc Finance
Updated
22 min read
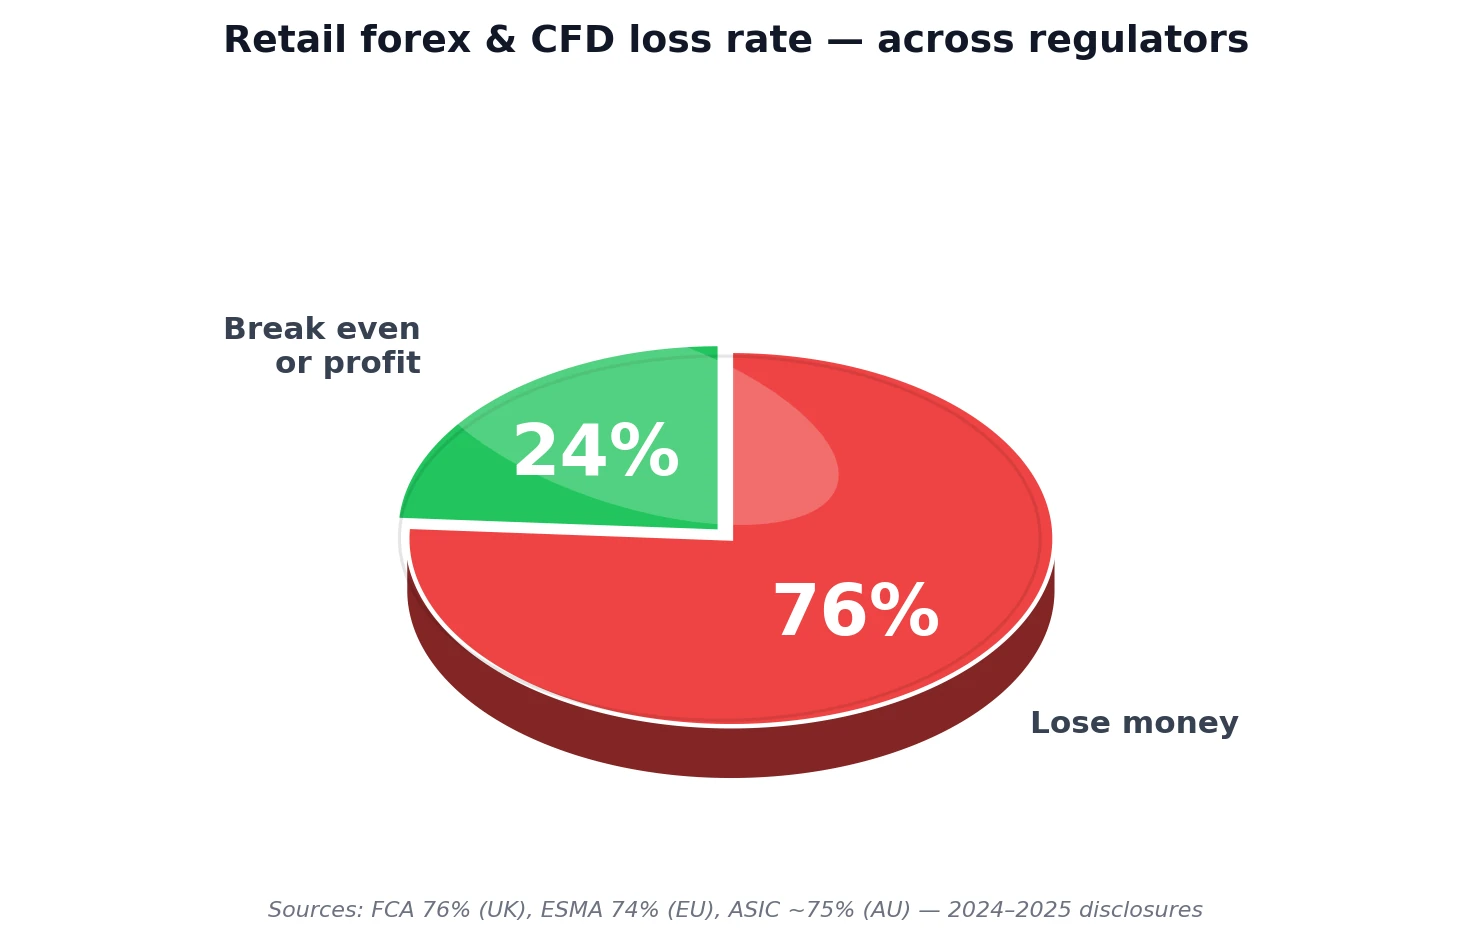
76% of retail forex traders lose money. The rest know something you're about to learn.
Forex is the largest financial market in the world. The Bank for International Settlements 2022 Triennial Survey put global daily turnover at $7.5 trillion, up from $6.6T three years earlier. That size is both the opportunity and the trap: liquidity means you'll almost always find a counterparty, but it also means the market has no mercy for the unprepared.
Now the part most beginner guides keep in the fine print. FCA disclosures show 76% of retail CFD accounts lose money in any given quarter. ESMA data puts the EU figure at 74%. ASIC Australia reports similar numbers. That ratio hasn't meaningfully moved in 15 years. If you're here because you want to be in the 20–30% who don't lose money, you already have the right posture: serious.
I've been trading full-time for 12 years, funded on prop challenges, and I've made every beginner mistake you're about to read about. This guide gives you what I wish someone had given me in year one, not 'get rich' promises, but the real mechanics. By the end you'll know how currency pairs are quoted, what leverage actually does to your account, how to read a candlestick chart without guessing, and, most importantly, how to size a position so that a losing streak doesn't wipe you out.
No hype. Just the foundations.
1 What is forex trading?
Forex trading is the buying and selling of currencies in pairs on a decentralized, over-the-counter (OTC) global market. You never buy one currency in isolation, every trade is simultaneously a buy of one and a sell of another. The market is open 24 hours a day, five days a week, connecting banks, hedge funds, corporations, and retail traders across time zones.
Forex is not an exchange like the NYSE. There's no central building, no opening bell. Instead, currency prices are quoted by a web of interbank desks, electronic communication networks (ECNs), and retail brokers, all updating in real time. When you click 'buy' on MetaTrader, your broker is either matching you with a liquidity provider or taking the other side themselves.
Why prices move
Currency prices respond to three things, in descending order of impact:
- Interest rate differentials, when the Fed hikes while the ECB holds, dollars become more attractive to hold. EUR/USD tends to fall over the following days.
- Trade and capital flows, a country that exports more than it imports sees its currency strengthen over time.
- Risk sentiment, in a 'risk-off' moment (stock crash, geopolitical shock), capital rushes into perceived safe havens: USD, CHF, JPY.
You don't need to be an economist to trade. You do need to know that these forces exist and that news events compress weeks of adjustment into minutes. That's why most retail traders avoid trading during major announcements until they know what they're doing.
The four sessions
Liquidity follows the sun. The market has four regional sessions, and knowing when each is active changes when you should trade:
| Session | Main financial center | Active hours (UTC) |
|---|---|---|
| Sydney | Australia | 22:00 – 07:00 |
| Tokyo | Japan | 00:00 – 09:00 |
| London | United Kingdom | 08:00 – 17:00 |
| New York | United States | 13:00 – 22:00 |
2 Currency pairs and how quotes work
Every forex trade is a relative bet. You're never buying or selling one currency on its own, you're always doing both at once. That's why every instrument is quoted as a pair.
Reading a quote
Take EUR/USD = 1.0950. That reads as: one euro buys 1.0950 US dollars. The first currency listed (EUR) is the base currency. The second (USD) is the quote currency, it tells you what the base is worth.
Buy the pair and you're effectively long euros and short dollars. Sell it and you're long dollars, short euros. Every forex position, no matter how exotic the pair, boils down to that simple logic.
The three pair categories
Not all currency pairs trade the same way. They group into three tiers:
- Majors, seven pairs that include USD against another top currency. EUR/USD, GBP/USD, USD/JPY, USD/CHF, AUD/USD, USD/CAD, NZD/USD. These are the deepest, most liquid pairs in the market. Typical spreads on a decent broker: 0.0–1.5 pips during active sessions.
- Minors (also called crosses), pairs of major currencies that don't include USD. EUR/GBP, AUD/JPY, GBP/CHF. Still very liquid; spreads typically run 1–3 pips.
- Exotics, pairs that include an emerging-market currency. USD/TRY, USD/ZAR, EUR/PLN, USD/MXN. Wider spreads (5–30 pips), larger overnight swap charges, sharper moves on political news. Not where beginners should start.
As a rule, beginners spend the first six months exclusively on majors. You can learn everything you need on EUR/USD alone.
The pip, forex's smallest unit
A pip (percentage in point) is the smallest standard price move. On most majors, a pip is a 0.0001 change in the quote, the fourth decimal place. So when EUR/USD moves from 1.0950 to 1.0951, that's a one-pip move.
On JPY pairs the convention differs: a pip is the second decimal place. USD/JPY moving from 150.25 to 150.26 is one pip.
Many brokers now quote a fractional pip (or 'pipette') at the fifth decimal. That's 1/10th of a pip. Useful for precise entries, but when people quote spreads or stops in conversation, they mean pips, not pipettes.
Bid, Ask, and the spread
Open any chart on MetaTrader and you'll see two prices, not one:
- Bid, what you can sell at (always the lower price)
- Ask, what you can buy at (always the higher price)
- Spread, the gap between them (Ask − Bid), kept by the broker as the cost of execution
On EUR/USD during the London / New York overlap, a decent ECN account shows a spread of 0.1–0.6 pips. On exotics, or outside peak hours, expect 5–10× that. The spread is your first real cost as a trader, on a scalping strategy with 5 trades a day, it can add up to more than your stop losses.
::pullquote. James Mitchell Every forex trade is a simultaneous buy and sell. Once that clicks, the rest of the jargon stops being jargon. ::
3 How does leverage work (and what it really costs)?
Leverage is a broker-provided multiplier that lets a small deposit control a much larger position. A 1:100 leverage account uses $1,000 of margin to control $100,000 of currency.
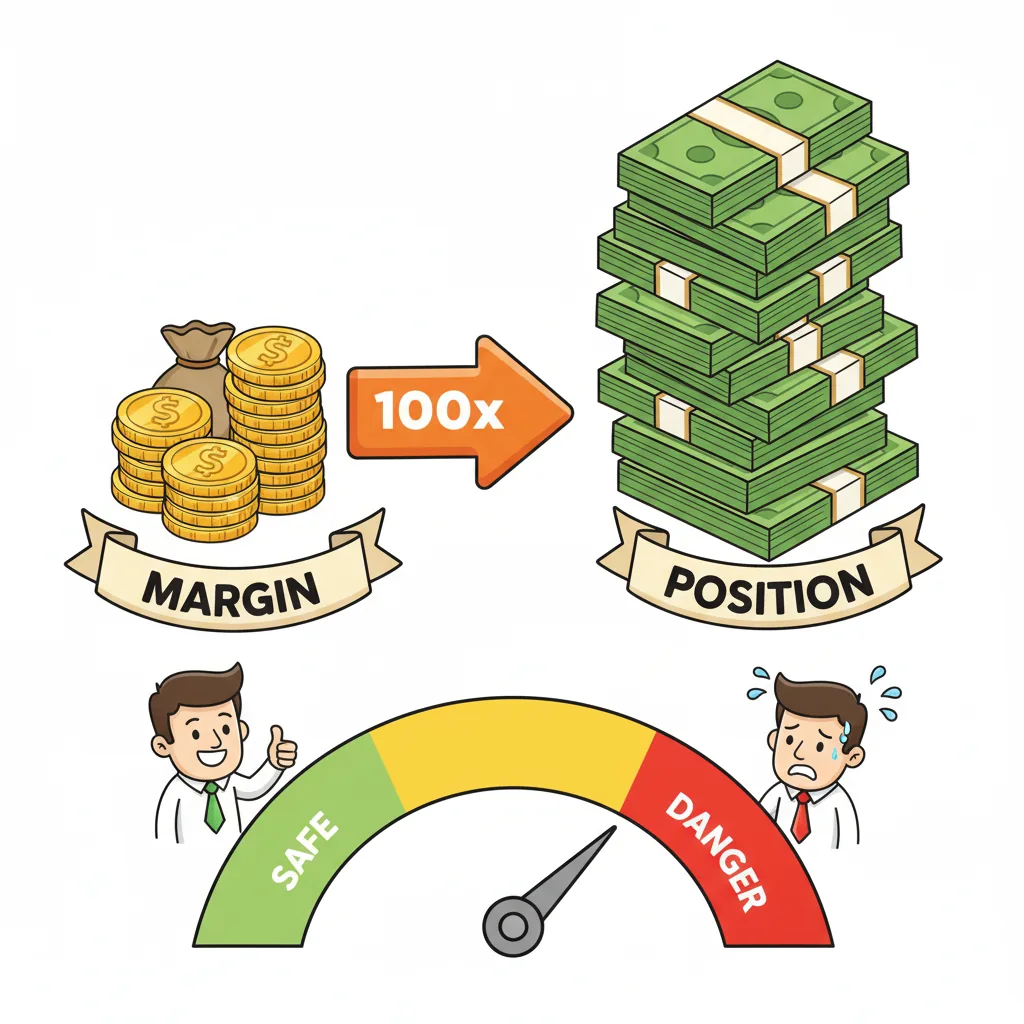
Higher leverage doesn't improve your edge, it magnifies whatever edge (or mistake) you already have.

It's the single most misunderstood concept in retail trading and the one that destroys the most accounts. Let's fix that in the next ten minutes.
What leverage actually does
Imagine you have $1,000 and you want to trade EUR/USD. Without leverage, you could only buy €1,000 worth of euros, and a 50-pip move in your favor would net you about $5. That's not a business, it's a hobby.
With 1:100 leverage, each $1 of your account can control $100 of currency. Your $1,000 now controls a $100,000 position (1 standard lot). The same 50-pip move is now worth $500, half your starting capital, one way or the other.
That's it. Leverage doesn't create money. It amplifies the consequences of whatever price move happens next. If your edge is real, leverage helps. If your edge is imaginary, leverage turns slow bleeding into fast death.
Regulated leverage caps, what your jurisdiction allows
Leverage limits vary wildly by regulator. If you trade from a jurisdiction with strict rules, your broker is legally required to cap how much leverage they offer you, no matter what their marketing says:
| Jurisdiction | Max retail leverage on majors | Regulator |
|---|---|---|
| EU / UK | 1:30 | ESMA / FCA |
| Australia | 1:30 | ASIC |
| USA | 1:50 | NFA / CFTC |
| Japan | 1:25 | JFSA |
| Switzerland | negotiated, typically 1:100 | FINMA |
| Offshore (SVG, Vanuatu) | up to 1:1000+ | limited oversight |
Margin, what you actually put up
Required margin is the deposit your broker locks up to let you hold the position. The formula is simple:
Required margin = Position size ÷ Leverage
A worked example on EUR/USD at 1.0950, 1 standard lot, 1:100 leverage:
- Position value: 100,000 units × 1.0950 = $109,500
- Required margin: $109,500 ÷ 100 = $1,095
Your broker sets that $1,095 aside from your usable balance. If the trade goes against you and your equity drops toward the margin level, the broker issues a margin call at 100% margin level. If you don't add funds or close positions, it force-closes you at the stop-out level, commonly 50%.
A margin call isn't an inconvenience. It means your risk management already failed, and you're about to find out how much you lose involuntarily.
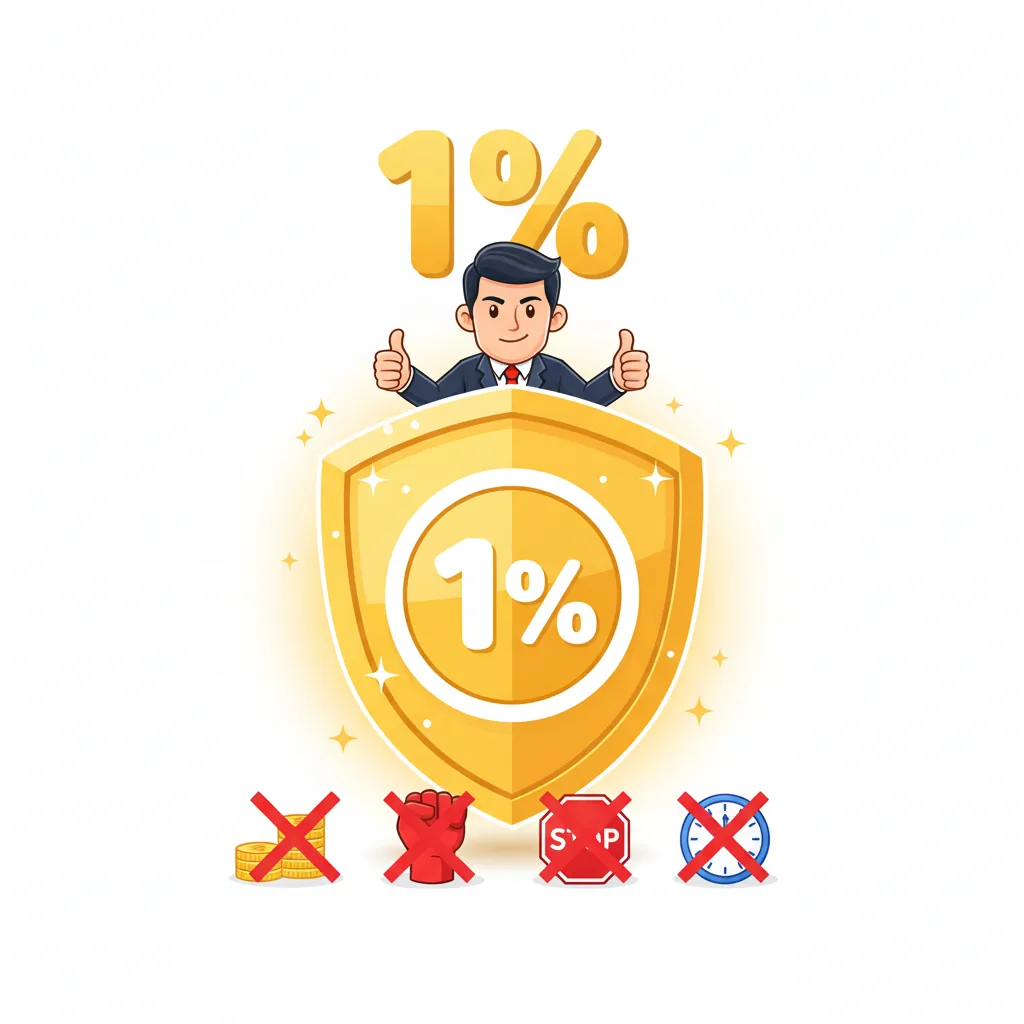
The 1% risk rule, the single most protective habit you can build
The rule is simple, and it's been the same for 50 years:
Never risk more than 1% of your account on a single trade.
'Risk' means the dollar loss if your stop-loss gets hit. It has nothing to do with the size of the position, a large position with a tight stop can have the same risk as a small position with a wide stop.
The math you'll do on every trade:
- Calculate 1% of your account.
- Divide by the stop distance in pips. That's your target risk-per-pip.
- Size your position to match that risk-per-pip (on USD-quoted majors: $10 per pip per standard lot, $1 per mini lot, $0.10 per micro lot).
Why experienced traders obsess over this
Every trader, eventually, has a losing streak. Six, eight, sometimes twelve losses in a row. If you've sized your risk honestly, that streak is a draw-down, uncomfortable, educational, survivable. If you haven't, that streak ends your account.
The 1% rule isn't about being cautious. It's about being able to play the game for 20 years instead of 20 weeks.
If you're thinking about sidestepping your own capital and trading leverage through a funded account instead, the economics of that trade-off, fees, profit splits, the realistic odds of passing, are covered in depth in our prop firm vs self-funded account breakdown.
4 How do you read a forex chart?
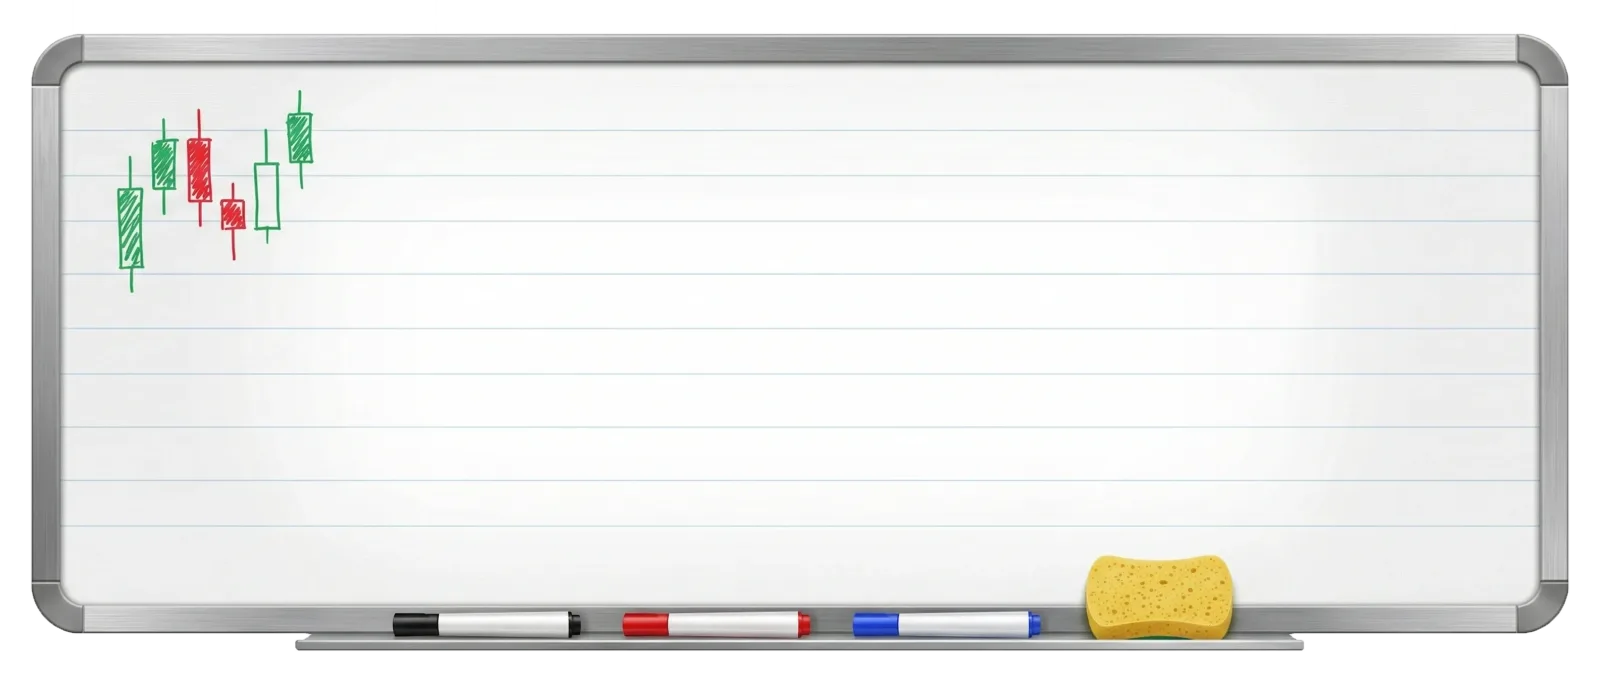
A forex chart is a visual timeline of price action over fixed time intervals. Most traders use candlestick charts, where each candle shows the open, high, low, and close for that interval. Coloured bodies reveal direction; wicks reveal the extremes reached. Learning to read candles fluently is the foundation of every technical strategy you'll use.
Candle anatomy
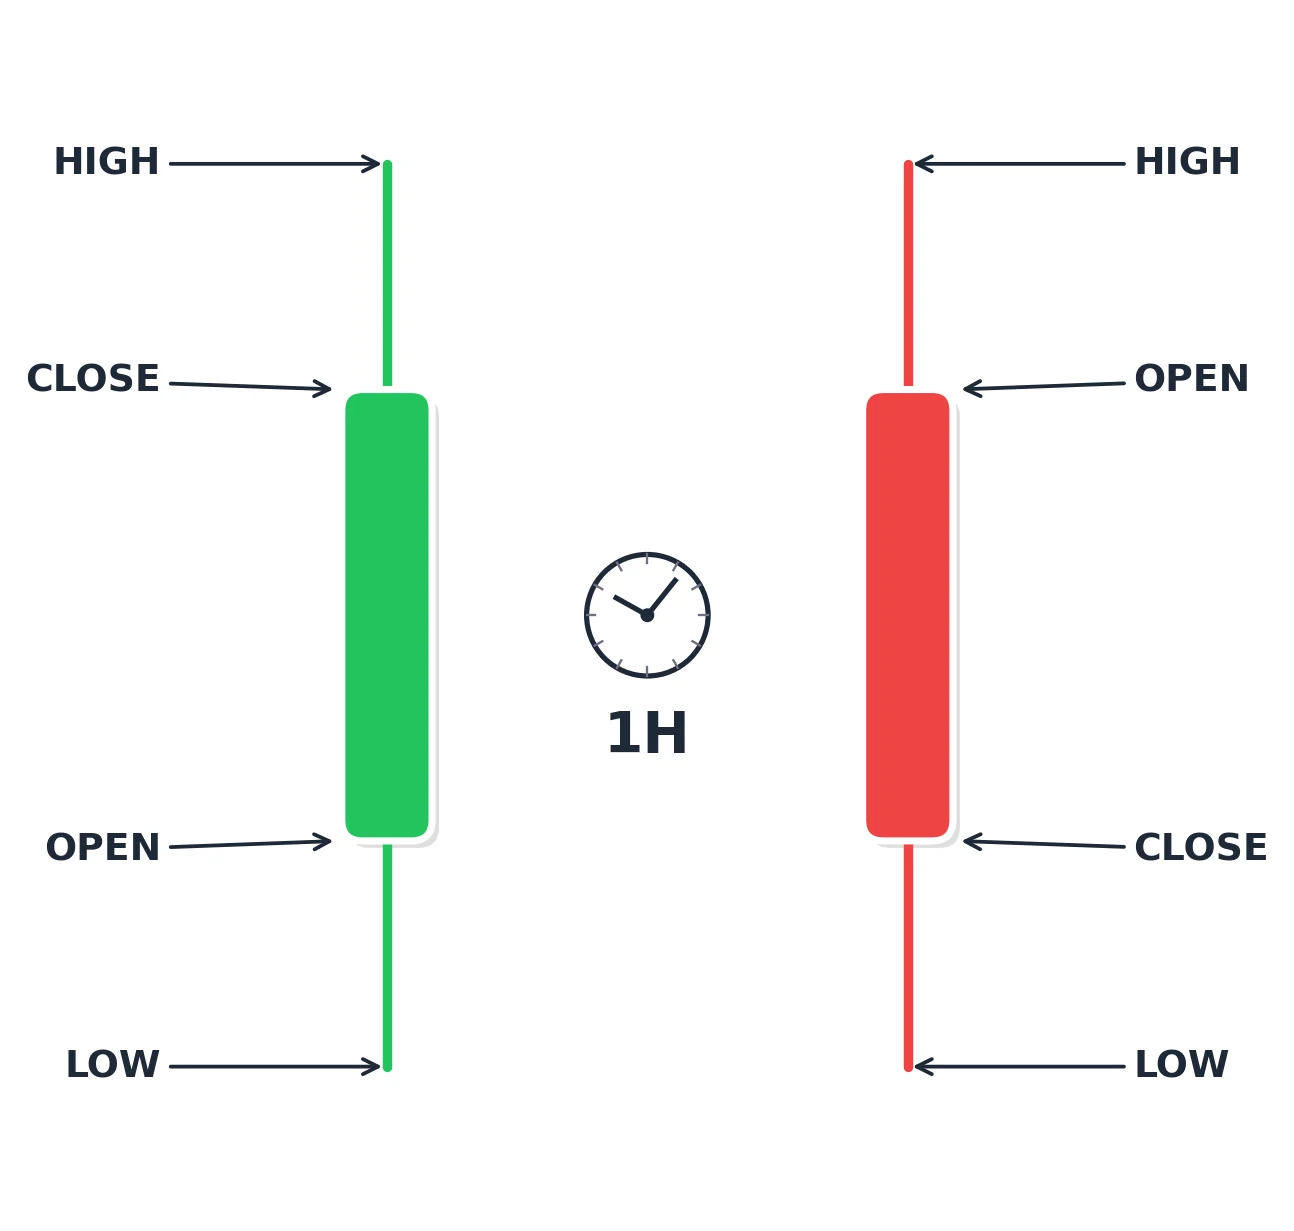
Every candlestick encodes four prices across one fixed window of time:
- Open, the price at the start of the interval
- High, the maximum reached during the interval
- Low, the minimum reached
- Close, the price at the end
The coloured box between open and close is the body. The thin lines extending above and below are the wicks (or shadows). Green (or white) means close higher than open, a bullish candle. Red (or black) means close lower than open, a bearish candle.
One candle on its own means little. Sequences of candles, and how their bodies and wicks relate to prior candles, are where the information lives.
Time frames and what each one tells you
The time frame you choose is the lens you're looking through. Zoom too far in and you see noise. Zoom too far out and you miss the setup. Most retail traders settle between H1 and D1 for entries, with H4 and D1 for context.
| Time frame | What one candle represents | Typical use |
|---|---|---|
| M1, M5 | 1–5 minutes | Scalping (most traders lose money here) |
| M15, M30 | 15–30 minutes | Intraday entries with confirmation |
| H1, H4 | 1–4 hours | Day trading and swing entries |
| D1 | Daily | Trend context, macro setups |
| W1 | Weekly | Long-term positioning |
The three market regimes, strip everything else away
Every strategy you'll ever study is a variation of one of three ideas about what price is doing right now:
- Uptrend, sequence of higher highs and higher lows. Buy pullbacks; avoid shorting.
- Downtrend, sequence of lower highs and lower lows. Sell rallies; avoid longing.
- Range, price oscillates between a floor (support) and a ceiling (resistance) with no clear directional progress. Fade the edges; avoid breakouts until they confirm.
The chart patterns, the Fibonacci tools, the Elliott waves, the harmonic theories, all of them ultimately try to answer one question: which of those three regimes am I in, and where's the edge?
A useful exercise: open any major pair on H4, go back six months of candles, and mark every section as uptrend, downtrend, or range. After 200 charts your eye starts to do it automatically, and once that happens, half the technical work is done before you've even picked an indicator.
Support, resistance, and the one honest truth about them
Support is a price level where buyers have repeatedly stepped in. Resistance is where sellers have. Draw them across swing highs and swing lows, and you'll see price respect them, until it doesn't.
The honest truth: levels work until they break, and nobody can tell you reliably in advance which will break and which will hold. The skill isn't predicting, it's positioning so you make money both ways. A bounce is a trade setup. A clean break is also a trade setup. You're not picking sides; you're watching price tell you which game it's playing.
5 Your first risk-managed trade, step by step
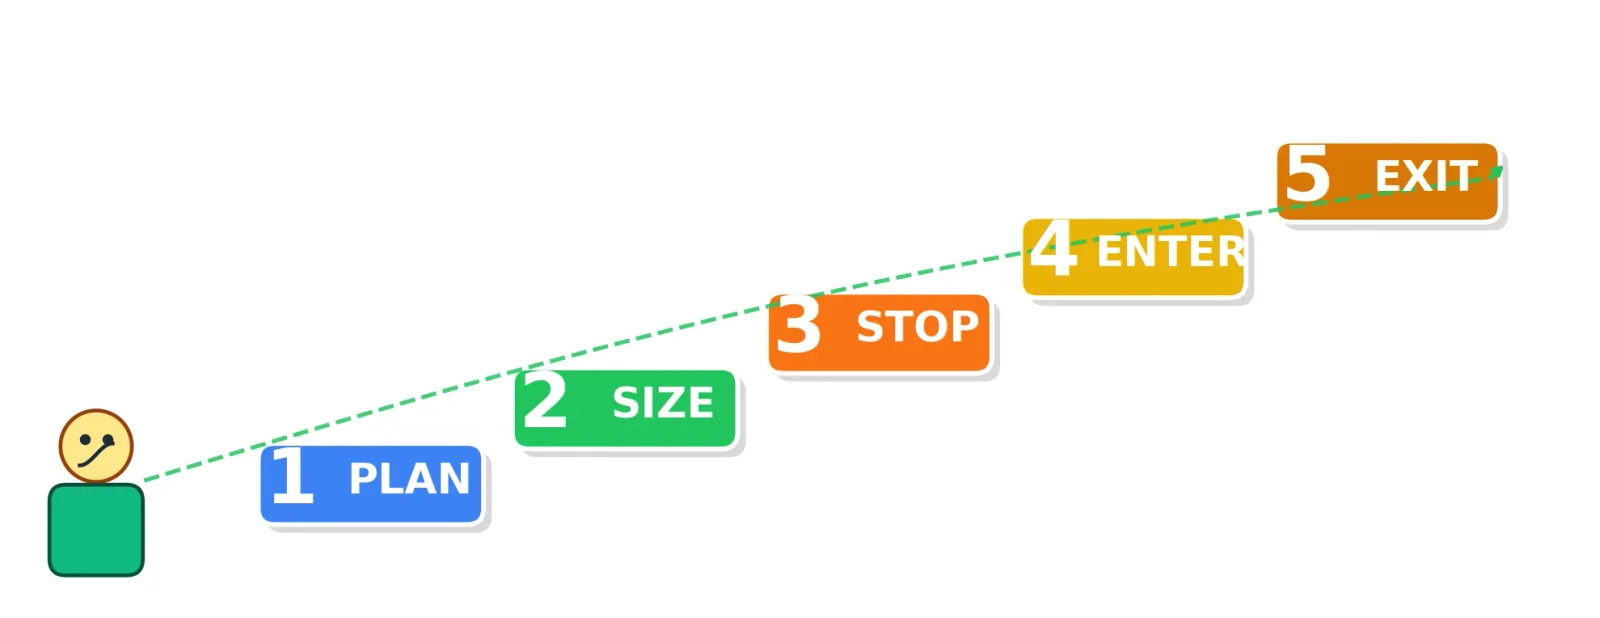
Enough theory. Let's walk through an actual trade from chart setup to exit, using real numbers on a real pair. This is the exact workflow I use on live accounts, 12 years in, simplified down to what genuinely matters.
Step 1. Set up your chart
Open EUR/USD on the H1 timeframe. Add three indicators:
- 8-period EMA (color it green)
- 21-period EMA (color it red)
- 200-period EMA (color it grey, dashed, this is your trend filter)
In a separate indicator pane: ADX(14). You'll use it to confirm whether the market is actually trending.
Step 2. Identify the macro bias
Look at the 200 EMA. If price is above it, your bias is long, you'll ignore short signals today. If below, bias is short.
For this example: EUR/USD is trading at 1.0870. The 200 EMA sits at 1.0810. Price is above. Bias: long only.
Step 3. Wait for a crossover with real momentum
London session opens. Over the next two hours, EUR/USD pushes from 1.0855 to 1.0880. The 8 EMA curves up and crosses above the 21 EMA at a steep angle, not a lazy horizontal drift.
Check ADX: it reads 28. Above 25 means the trend has enough strength to take seriously. Below 20 means the market is ranging and the crossover is noise. Yours says 28. Green light.
Step 4. Don't chase. Wait for the pullback.
This is where discipline separates profitable traders from everyone else.
Amateurs enter on the crossover. Professionals wait for the pullback.
After the crossover, price continues to 1.0895, then retraces over three candles back into the EMA zone (the space between the 8 and 21 EMAs). At 1.0872, it's testing the zone as dynamic support. This retracement is your setup. Not the initial crossover. The pullback.

Step 5. Enter on a confirmation candle
The fourth candle after the pullback prints a bullish engulfing pattern at 1.0875, closing at 1.0888. The body is entirely within or above the EMA zone. That's your signal.
| Parameter | Value |
|---|---|
| Entry | 1.0888 |
| Stop-loss | 1.0853 (below the 21 EMA, with a 12-pip buffer so normal wicks don't stop us out prematurely) |
| Risk in pips | 35 |
| Target (1:2 R:R) | 1.0958 |
| Position size on $5,000 account | 0.17 lots (for $50 max loss = 1%) |
Step 6. Manage the trade
Once price moves 35 pips in your favor (you're now at 1:1), slide your stop to breakeven (1.0888). The trade is now free, worst case, you get stopped out at entry for zero.
If price closes below the 21 EMA at any point, your premise is invalidated. Exit manually, don't wait for the stop. The setup is gone.
Let the 1:2 target fill at 1.0958, or trail the stop below the rising 21 EMA. Either approach works. The discipline is in having a rule and following it.
Step 7. What if it goes wrong?
It will, sometimes. Here's the honest part most guides skip.
You might enter at 1.0888 and watch price reverse to 1.0860 within two candles. You take the 35-pip loss. $50 gone. That's the 1% rule working exactly as designed, you're down 1%, and ready for the next trade.
You might enter, see it run to 1.0940, think 'this is my trade', and move your stop to lock in profits... only to get stopped out at breakeven when price retraces. Zero PnL. Annoying, but correct.
You might be stopped out by a news spike you didn't account for. Losing to news blind is a lesson, not a tragedy. Next time, check the economic calendar.
Step 8. Journal the trade
I ran this exact setup as my core system through most of 2019, my second year trading seriously. Across 140 live H1 EUR/USD setups, my hit rate came out at 55% with an average reward-to-risk of 1.6:1. That's consistently profitable with the 1% rule, and nothing close to the 75% win rates you'll see on YouTube thumbnails. Real edges are small. Compounded over years, they're enough.
Beyond this single EUR/USD setup, there are a handful of simple systems worth learning next, a walkthrough of five beginner-friendly strategies is on our forex strategies for beginners guide.
6 Common beginner mistakes (and the one rule that prevents most)
Most trading books list beginner mistakes as a checklist of things you shouldn't do. That's not quite honest. You'll do most of them anyway, because the lesson isn't teachable by reading. It's teachable by losing money. What the checklist CAN do is shorten how long each mistake costs you, by making the pattern recognisable when you're mid-mistake.
Here are the five that cost me the most. Each comes with the specific dollar damage it does when left unchecked, and the rule that neutralises it.
1. Overleveraging the position
What it looks like: you have a $2,000 account. Your strategy says size 0.2 lots to risk 1%. You feel strongly about the setup. You enter 0.8 lots instead, reasoning that you know this one is going to work.
What it costs: if the setup wins, you pocket 4× the planned profit and feel brilliant. The problem is the next time you 'know for sure', and the time after that. Across ten 'conviction trades' at 4× size, one losing streak of three wipes 12% of your account. On your planned sizing it would have been 3%.
The rule: size is determined by the stop distance and the 1% rule. Not by conviction. Conviction is not sizing information; it's a feeling.
2. Revenge trading after a loss
What it looks like: the 1.0853 stop gets hit. You lose $50 as planned. Immediately you re-enter the same direction, bigger this time, convinced the move is about to play out.
What it costs: revenge trades are statistically losing trades. Your strategy's edge disappears when the entry reason changes from 'my setup triggered' to 'I need to make that $50 back'. The same distribution that produced one loss now produces two or three, sized larger each time.
The rule: after any losing trade, close the platform for at least 30 minutes. If you can't, the issue isn't this trade, it's that you haven't processed yet that trading means losing some trades on purpose.
3. Moving the stop to avoid the loss
What it looks like: price approaches 1.0853. With five pips to go, you slide the stop to 1.0843 because 'it's going to bounce'.
What it costs: it won't. When stops move against the plan, they keep moving. A 35-pip loss becomes 55, then 80, then 150. A single instance of this habit can erase three good weeks of disciplined trading. I watched it happen to a funded trader I know in 2021, he moved a stop twice on the same USD/JPY short and converted a $300 planned loss into a $4,800 blown challenge.
The rule: once the trade is live, stops only move in your favour. Never against. Write it on paper and tape it to the monitor if you need to.
4. Over-trading when nothing is setting up
What it looks like: the market is ranging sideways, no setups triggering. You've been at the screen for four hours. You force-enter something marginal just to feel like you traded.
What it costs: force-trades aren't setups. They're boredom with a broker attached. The P&L math is brutal, across a year of daily trading, a trader with 50 quality setups and 120 boredom trades usually nets negative purely because the boredom trades have no edge but still pay the spread.
The rule: a good trading week has two or three quality setups, not twenty. If you find yourself scrolling brokers or timeframes looking for something to do, the market is telling you to step away.
5. Trading through major news blind
What it looks like: your strategy is fine on normal liquidity. You enter EUR/USD at 14:29 UTC. At 14:30, Fed Chair Powell starts speaking. Your 30-pip stop gets filled at -120 pips because spreads widened to 15 pips and slippage did the rest.
What it costs: news-blind fills are the worst kind of loss, not because the strategy was wrong but because the conditions were. You planned for normal-market mechanics; the market delivered pre-news mechanics.
The rule: before every session, open an economic calendar (ForexFactory or your broker's). Close every existing position 15 minutes before any high-impact red news on currencies you're holding. Re-enter after volatility settles if the setup survives.
The one rule that catches the rest
Every mistake above compounds differently, but they all share one property: the 1% risk rule caps how bad any single instance can be. You can revenge-trade at 1% and still survive the week. You can force a bad entry at 1% and still survive the year. You can move a stop once at 1% and only lose double, not quadruple.
That's why the rule earns its reputation as the single highest-leverage habit in retail trading. It doesn't prevent you from being stupid. It prevents stupid from being fatal. For a beginner, that distinction is the whole game.
If you're heading toward a prop firm challenge after reading this, every mistake above gets amplified by the evaluation clock and daily-loss limits. We cover how to sidestep each of them under challenge conditions in our prop firm challenge survival guide.
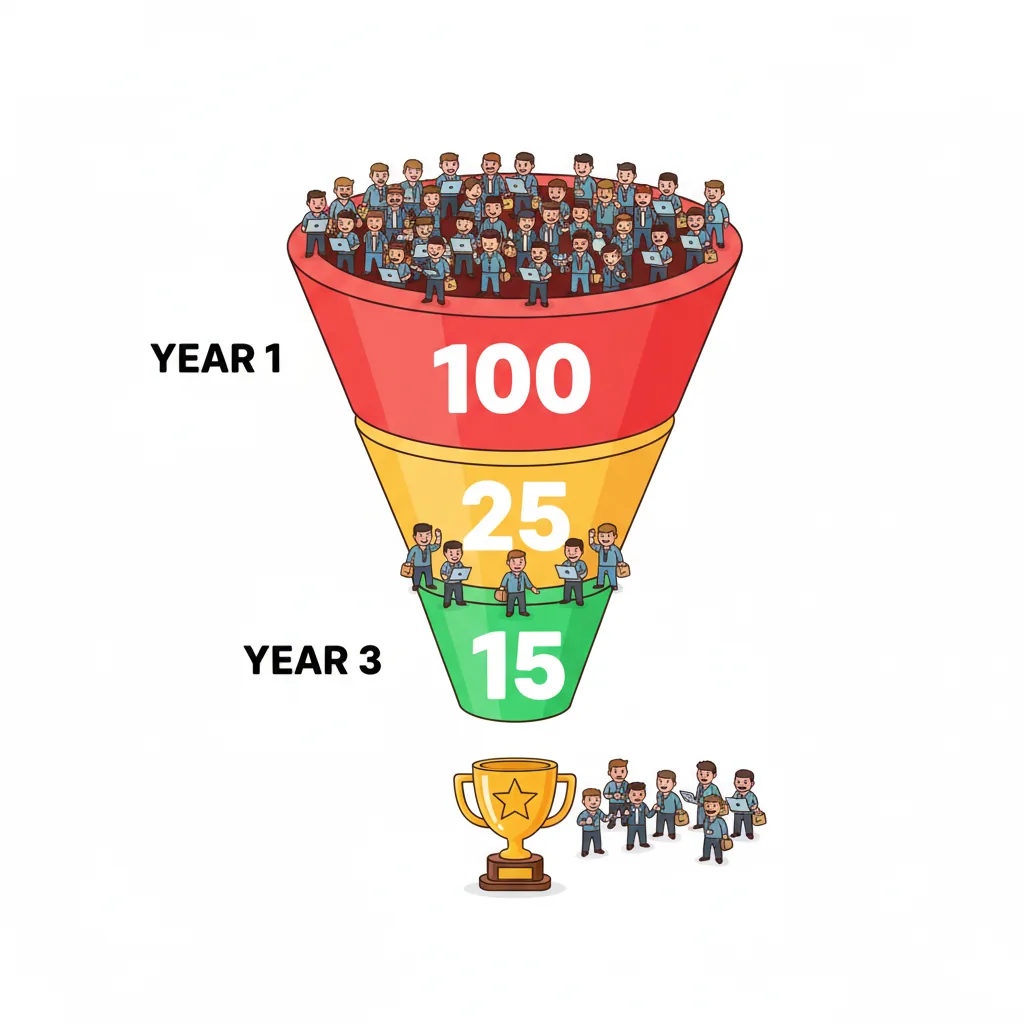
7 How long does it take to become profitable?
Becoming profitable in forex is not a 30-day journey, and any source telling you otherwise is selling. The honest industry data points to 1–3 years for the traders who get there, and the majority never get there at all. That sounds harsh. It's also the number you need before you decide how to allocate your time and capital.
The brutal arithmetic of retail trading
Broker disclosures are the most reliable source because every EU-regulated broker is legally required to publish them. Here's what they say about the most recent periods:
| Regulator / region | Retail accounts losing money | Source period |
|---|---|---|
| FCA (UK) | ~76% | 2024 rolling |
| ESMA (EU) | ~74% | 2024 rolling |
| ASIC (Australia) | ~72% | 2023–24 |
| NFA (US, retail forex) | ~65% | 2024 |
The inner ring is more interesting. Of the 20–30% not losing in a given quarter, most are break-even or marginally positive, not a sustainable career. The subset actually compounding real capital is closer to 10–15% of all retail traders at any time, and a far smaller percentage over multi-year horizons.
The 1–3 year timeline

For the traders who do make it to consistent profitability, industry surveys and trader interviews converge on a 12–36 month median learning curve. That range absorbs several real variables:
- Starting capital (bigger accounts have more margin for error, more time to learn)
- Hours per week dedicated (10 hours a week vs. 40 makes a real difference)
- Strategy complexity (simple trend-following rules are faster to calibrate than pattern-based discretionary systems)
- Psychological wiring (some people absorb the 'accept the loss' lesson in six months; others fight it for five years)
If you're a working professional putting 5–10 hours a week into trading with a $2,000 account, don't expect to be net profitable before month 18. That's not pessimism, it's the pace at which humans learn genuinely new probabilistic skills.
What separates the 10–15% who make it
It's rarely the strategy. It's almost always one of three things:
- Risk management that's actually followed. Every profitable trader I know treats the 1% rule as non-negotiable. Not 'usually 1%'. Always 1%. That discipline alone cuts the blow-up rate by something like 80%.
- Strategy with measurable positive expectancy. They've run at least 100 live trades through their rules and can state, in numbers, their expected value per trade. They know their hit rate, their average R:R, and roughly what a bad month looks like.
- Psychological stability through losing streaks. Every strategy with an edge also has losing streaks. The profitable traders have sat through 8-loss runs without abandoning the system. The 70–80% who lose money either (a) change systems after every bad week or (b) up their risk during drawdowns to 'make it back'.
Those three items, in that order. Strategy is the least of the three, most retail strategies have some edge; most retail traders don't have the discipline to deploy that edge long enough for it to compound.
Realistic returns for the ones who get there
Retail trading isn't the path to 100%-a-month returns, no matter what a specific YouTube channel showed last Tuesday. Here's the honest distribution:
- Top retail traders: 10–25% annual returns, net of drawdowns. This is genuinely good, it matches or beats elite hedge fund managers.
- Above-average profitable retail: 5–10% annual.
- Break-even retail: 0% to 3% annual (not meaningfully different from leaving capital in an index fund, but with far more effort and stress).
- Bad actors and influencers: claim 100–1,000% annually. These are either (a) survivorship-bias stories, (b) results from a 6-month lucky streak presented as typical, or (c) simply fabricated screenshots.
At 20% compounded annually, $10,000 becomes $1 million in about 26 years. That's what real compounding looks like. It's also why the traders who make it are patient by temperament, they're playing a very long game at a pace that genuinely works.
The question isn't 'will I get rich trading forex?'. It's 'will I survive long enough for my edge to compound?'.
If you internalise only one thing from this guide, make it that reframing. Beginners ask the first question. The 10–15% who make it only ever ask the second.
For traders who do reach consistency on their own capital, scaling via a funded account is a reasonable next step, the current landscape of firms, challenge costs, and payout structures is mapped out in our best prop firms for 2026 comparison.
8 References
Every number and regulatory claim in this guide traces to one of the sources below. All URLs verified 2026-04-18.
- Bank for International Settlements, Triennial Central Bank Survey 2022: global FX turnover averaged $7.5 trillion per day. Accessed 2026-04-18.
- Financial Conduct Authority (FCA, UK), Retail CFD and forex loss statistics disclosures. Required quarterly publication by all FCA-regulated CFD brokers; ~76% UK retail loss rate in 2024. Accessed 2026-04-18.
- European Securities and Markets Authority (ESMA), Product intervention measures for CFDs, including 1:30 retail leverage cap on majors. Accessed 2026-04-18.
- Australian Securities and Investments Commission (ASIC), Retail OTC derivative product intervention order (1:30 leverage cap, retail loss data). Accessed 2026-04-18.
- National Futures Association (NFA, USA), Retail forex regulatory guide: 1:50 leverage cap on majors, customer protection rules. Accessed 2026-04-18.
- MetaQuotes Software, MetaTrader 5 Client Terminal documentation. Reference for order entry, lot sizing conventions, and platform mechanics cited throughout. Accessed 2026-04-18.
- Bank of Japan / JFSA, Forex margin trading regulations: 1:25 retail leverage cap on majors. Accessed 2026-04-18.
---
Disclaimer: This content is for educational purposes only and does not constitute investment advice. Trading forex and CFDs carries significant risk of loss, 70–80% of retail traders lose money, as documented by FCA, ESMA, and ASIC disclosures cited above. Past performance is not indicative of future results. Consult a licensed financial adviser and consider your personal financial situation before trading. Never risk money you cannot afford to lose.
---
A note on how this guide was produced. Research synthesis and first-draft structural outlines were assisted by AI tools. Every regulatory citation, statistic, and broker reference in this guide was then verified by hand against the original source, and the analysis, opinions, and risk framings are the author's. The illustrations (Professor Winston, hero image, infographics) are AI-generated. Full editorial methodology on our About page.
Frequently asked questions
How much money do I need to start forex trading?
Most regulated brokers let you open a live account with $50–$100. But 'technically possible' and 'actually wise' are different things. With a $100 account and 1% risk per trade, you're risking $1 per trade, not enough margin of error to survive a normal losing streak after spreads and commissions.
A realistic minimum for learning on live is $500–$1,000. That lets you size positions meaningfully while still only risking 1–2% per trade. Below $500, the spread cost eats a disproportionate share of your expected profit on every trade.
If you haven't demo-traded consistently for at least 30 days, the answer is: zero. Don't fund a live account until a demo account has been genuinely profitable over 50+ trades.
Is forex trading profitable for beginners?
Statistics from broker regulatory disclosures show 70–80% of retail forex and CFD traders lose money in any given quarter (FCA puts UK at ~76%, ESMA EU at ~74%). That number hasn't changed meaningfully in 15 years.
Profitability is possible but requires a genuine edge, a strategy with positive expected value plus the discipline to follow it through losing streaks. Most traders who do become profitable take 12 to 36 months to get there. Anyone promising faster results is selling something, typically a course or a signal service.
What's the difference between forex and CFDs?
At the retail level, execution looks identical, you're clicking the same buy/sell buttons on the same platform. The difference is legal structure: spot forex is a direct (or agent-matched) exchange of currencies; a forex CFD is a contract with your broker that tracks the currency price without any actual currency changing hands.
This matters for regulation, tax treatment, and counterparty risk. In the EU, UK, and Australia, almost all retail 'forex' is technically CFD trading, which is why your broker's risk warning mentions CFDs. In the US, CFDs are largely not permitted for retail, and genuine spot forex accounts are the norm.
Can I become a millionaire trading forex?
With enough time, enough capital, and a real edge, yes, but probably not by the path you're imagining. The top retail forex traders compound 10–25% per year, similar to what elite hedge fund managers deliver. At 20% compounded annually, $10,000 becomes $1 million in about 26 years.
The '100% per month' narratives you see on social media are either survivorship bias (the one lucky trader shown, not the 99 who blew up) or outright fabrication (backtested results, demo accounts, or edited screenshots). If you're in forex for steady long-term wealth building, the math works. If you're here for fast money, the statistics are against you.
Do I need to study economics to trade forex?
Less than you'd think. Understanding that interest rate differentials drive currency flows helps. Knowing why USD typically strengthens during risk-off events is useful context. But you don't need a finance degree, 90% of profitable retail traders use primarily technical analysis, and they do fine.
What you absolutely need: rigorous risk management (the 1% rule and its consequences), the emotional discipline to follow your own rules when you don't feel like it, and enough market experience to recognize when conditions have changed. Those take years to develop. Economics knowledge is optional; discipline is not.
James Mitchell
Fact-checkedSenior Trading Analyst · MSc Finance
James holds a Master's in Finance and has spent the last ten years trading forex and CFDs, mostly on his own book, occasionally on prop-funded accounts. He writes about the quiet gap between broker marketing and broker T&Cs, and believes the single best edge a retail trader can build is learning to read a regulator disclosure carefully.